Filter and Sort Data on Charts in Excel
Create a dynamic chart in Excel that displays only the data you want. You can filter it and sort it in order to drill-down into the data and get a visual representation of everything.
This is a fairly simply concept that will make your charts come to life when and how you need them to.
Sections:
Basic Data Setup
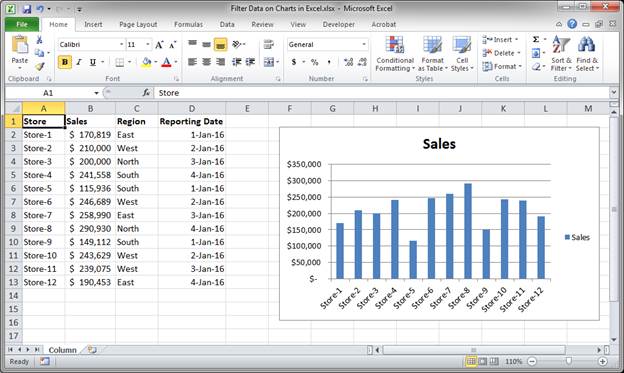
First, setup your data and create a chart that you want to use.
Here is the basic data setup:
Select a cell from the data that is included in the chart and then go to the Data tab and click the Filter button.
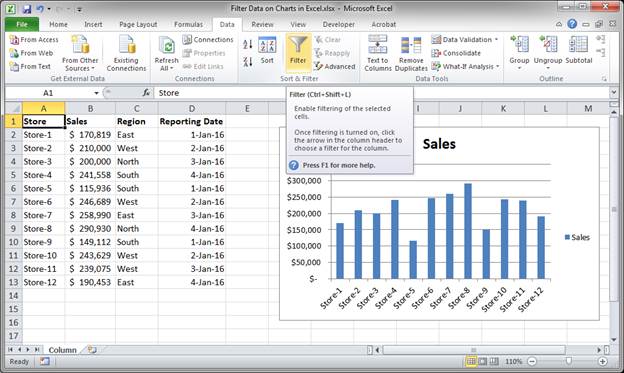
Make sure you have headers/titles in the first row and everything will be ok.
Now, all you have to do is to filter and sort the data as usual and the chart will update and only show the data that is visible after filtering.
Filter Data on a Chart
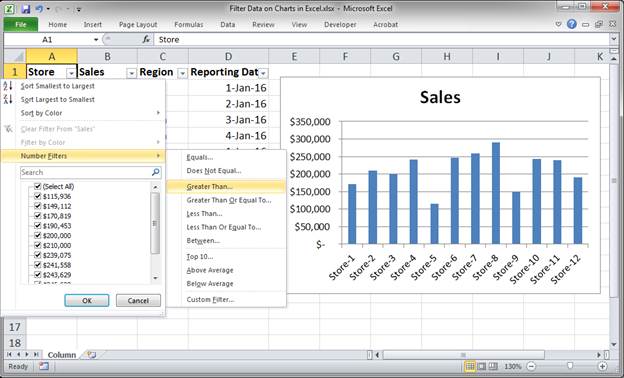
Let's show only the stores with sales over $180,000 and that are from the Eastern region.
- Click the arrow next to where the cell says Sales and then click Number Filters and Greater Than...
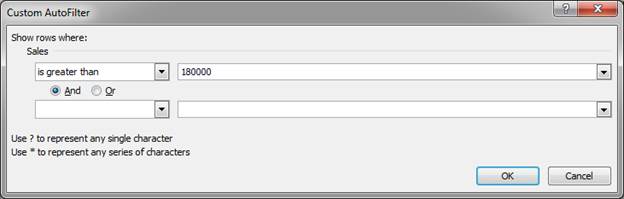
- Type 180000 into the window and hit OK.
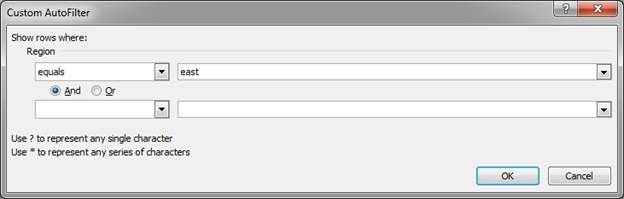
- Now click the arrow next to title Region and go to Text Filters and click Equals...

- In the window that opens type East and hit OK.
- That's it!
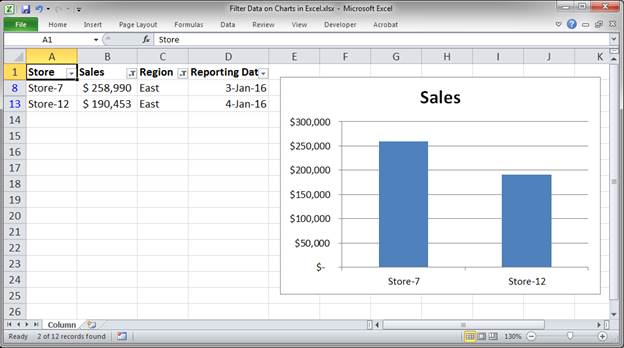
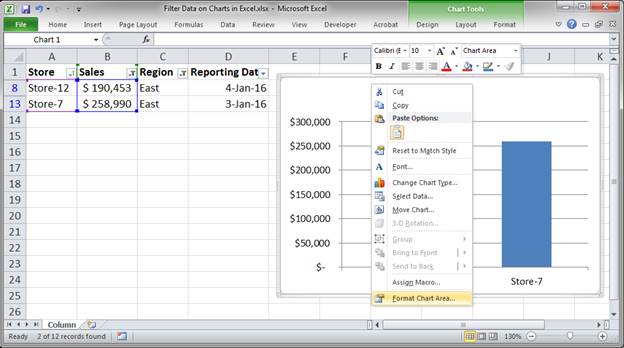
Now we have filtered the data down to two stores and we can clearly see their sales visually represented on the chart.
To go back to the original chart just clear the filters by clicking the filter icon in the header of the Sales and Region title cells and then click the Clear Filter from "...." option.

This was a simple example to show you that you can filter the data in your charts to get them to display any desired subset of data.
Sort Data on a Chart
You can sort the data just like you can filter it and it will update in the chart.
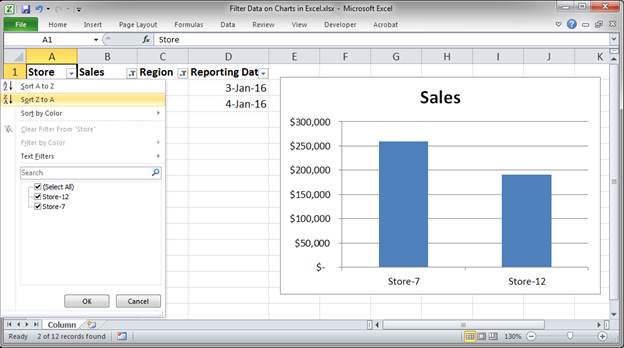
Following the example above, if I wanted to change the order of the stores I can simply click the Arrow next to the title Store and click the desired sort button.
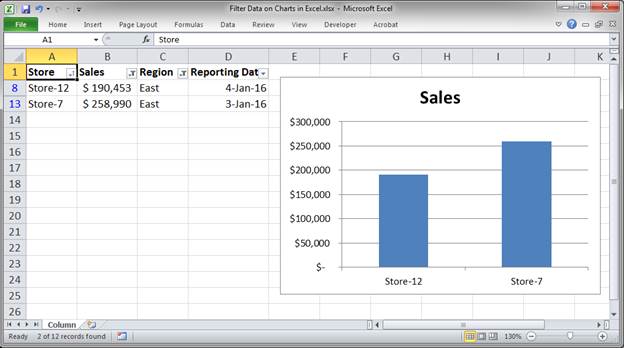
Now the store order will be reversed:
Note that sorting on text with numbers at the end, such as the Store column in this example, can be confusing and it's easier to sort on cells that contain only numbers or text.
Chart Resizing Problem
Filtering data technically hides rows, which will shrink your chart unless you have the correct settings.
Right-click the chart and click Format Chart Area...
In the window that opens, go to the Properties section and select Don't move or size with cells and then hit Close.
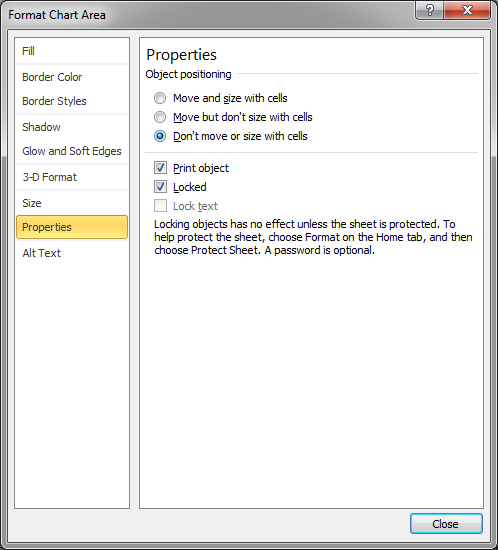
Once you do this the chart won't resize when you filter the data it displays.
Notes
This tutorial shows you that you can represent any set of filtered and sorted data in a chart that will update to display the data as you want in Excel. The concepts themselves are not difficult to grasp, just remember that you can combine them for a more versatile Chart experience.
Download the sample workbook attached to this tutorial to try out filtering and sorting data in Charts.
Question? Ask it in our Excel Forum
Excel VBA Course - From Beginner to Expert
200+ Video Lessons 50+ Hours of Instruction 200+ Excel Guides
Become a master of VBA and Macros in Excel and learn how to automate all of your tasks in Excel with this online course. (No VBA experience required.)
Tutorial: In this tutorial I am going to go through the Layout tab in more detail and show you how t...
Tutorial: You can change the size of the units on a chart axis, their interval, where they start, w...
Tutorial: In this tutorial I am going to introduce you to creating and managing charts in Excel. Bef...
Tutorial: In this tutorial I am going to show you how to update, change and manage the data used by ...
Tutorial: In this tutorial I am going to show you how to combine multiple chart types to create a si...
Tutorial: How to add, manage, and remove error bars in charts in Excel. Error bars allow you to sh...
Subscribe for Weekly Tutorials
BONUS: subscribe now to download our Top Tutorials Ebook!
Excel VBA Course - From Beginner to Expert
200+ Video Lessons
50+ Hours of Video
200+ Excel Guides
Become a master of VBA and Macros in Excel and learn how to automate all of your tasks in Excel with this online course. (No VBA experience required.)