Dynamic Charts in Excel - The Easy Way
How to create dynamic charts that update automatically when new data is added to Excel. This works with adding new rows and new columns of data to the table.
This method uses the table feature in Excel and is very easy to do.
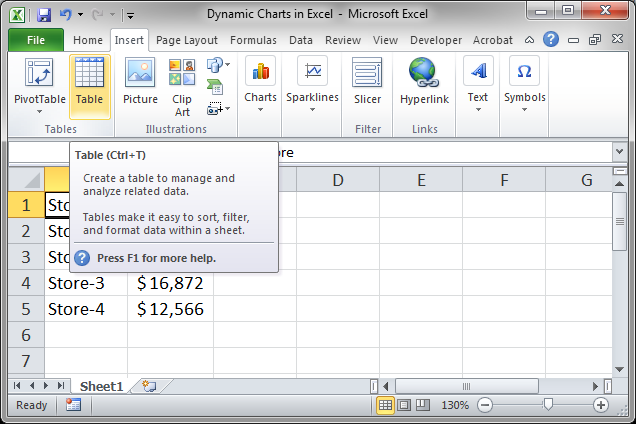
- Select the data that you want to chart or just select a cell within that data. Go to the Insert tab and click Table. You can also use Ctrl + T to turn the data into a table.
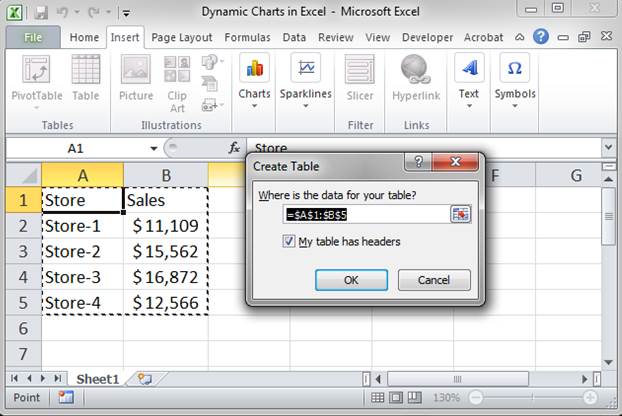
- A small window will open. Make sure your data has been selected and, if it has headers, put a check next to the My table has headers option and click OK.
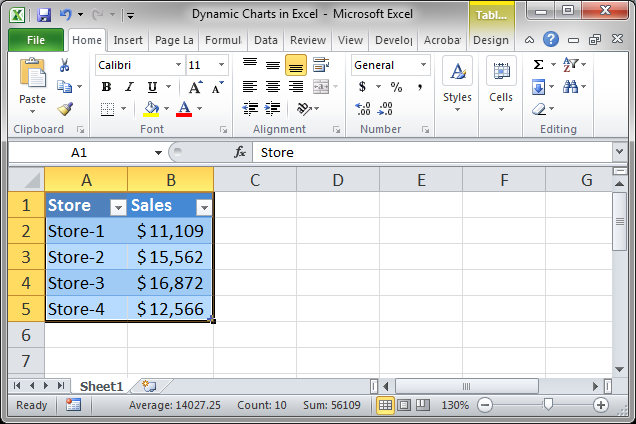
- You data should now look like this:
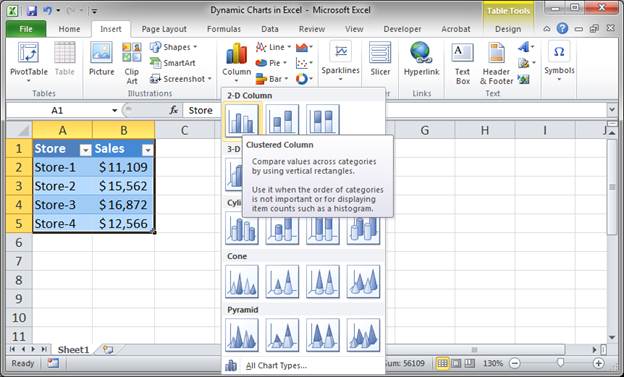
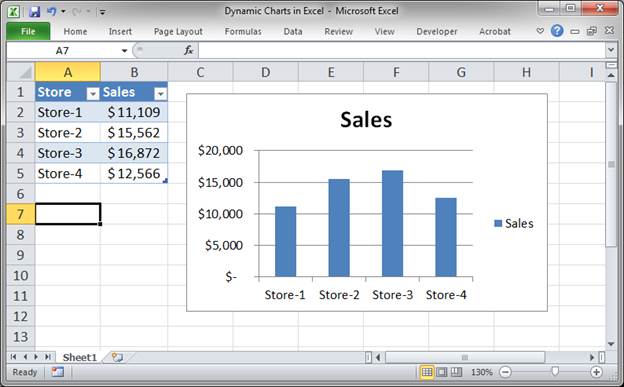
- By default the new table will be selected, if it is not, select it. Go to the Insert tab and select whichever chart type you want and click it.
- Here is what we have now:
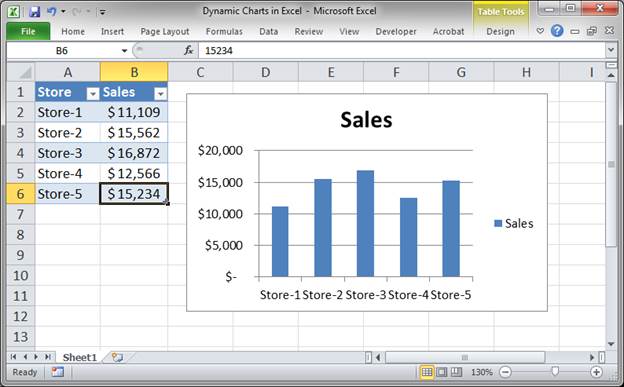
- Add a value to the next line in the table and the chart will automatically update.
Notes
All we did here is to turn our data into the table format in Excel and then chart it. Using this method, it is easy to create a dynamically updating chart in Excel. There is also another way to do this using dynamic formulas but that is much more complicated.
Download the workbook for this tutorial to see this dynamic chart in Excel.
Question? Ask it in our Excel Forum
Excel VBA Course - From Beginner to Expert
200+ Video Lessons 50+ Hours of Instruction 200+ Excel Guides
Become a master of VBA and Macros in Excel and learn how to automate all of your tasks in Excel with this online course. (No VBA experience required.)
Subscribe for Weekly Tutorials
BONUS: subscribe now to download our Top Tutorials Ebook!
Excel VBA Course - From Beginner to Expert
200+ Video Lessons
50+ Hours of Video
200+ Excel Guides
Become a master of VBA and Macros in Excel and learn how to automate all of your tasks in Excel with this online course. (No VBA experience required.)