Create and Manage Tables in Excel
Here, I'll show you everything you need to know to get started using tables in Excel; how to create, edit, and manage them.
A table is a special configuration that allows you to manipulate and analyze your data with maximum efficiency. Converting your data set into a table allows you to quickly format, sort, filter, sum, and analyze the data.
Sections:
Add a Total Row with Automated Functions
Create a Table
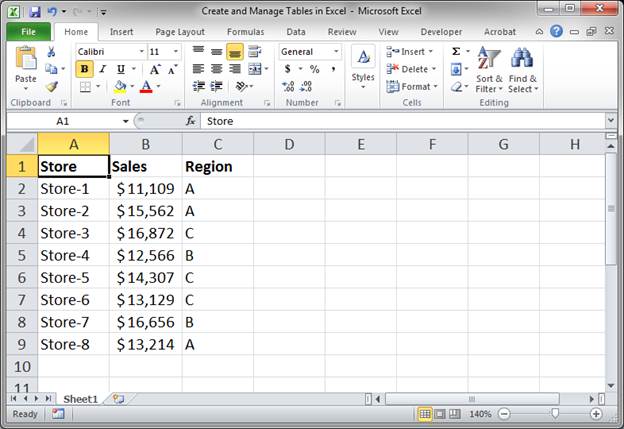
We must turn our data set into a table before we can use its features.
- Setup your data. Make sure that it has headers for each column. Though this isn't actually necessary, the table feature works much better with headers.
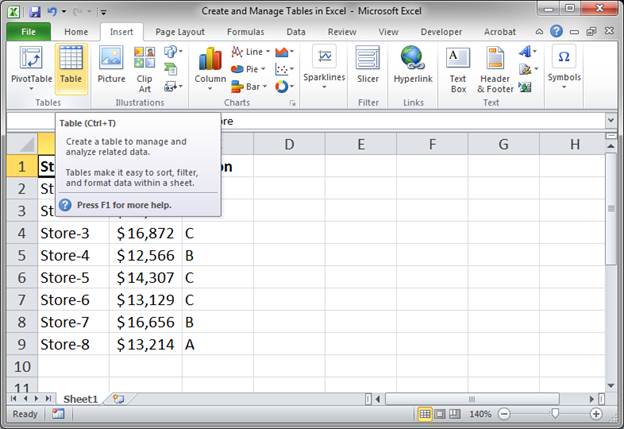
- Select a cell within your data set, or select the entire data set and go to the Insert tab and click Table.
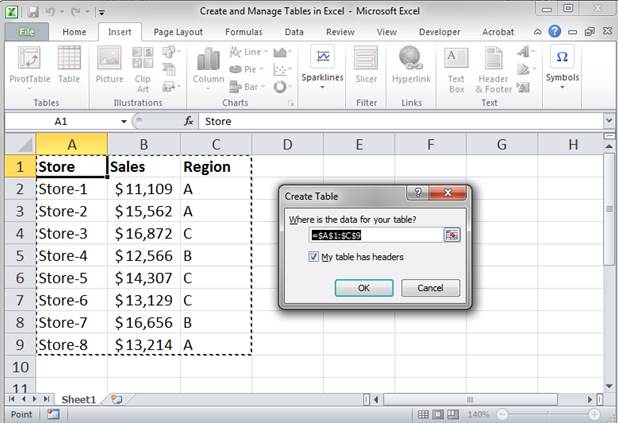
- Make sure that Excel selected the correct range for your data and that My table has headers is selected if your data already has its own headers. Then click OK.
- Now, you've got a nice table.
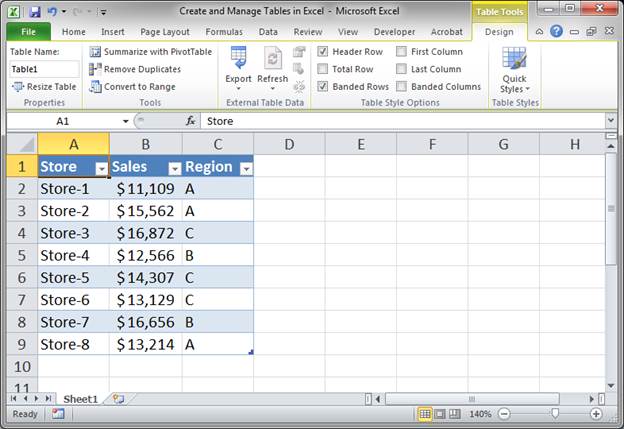
All the things you need to manage this table are located on the Design tab that appears when you select any cell within the table.
There are many nice features that we can now use so keep reading.
Format a Table
You can change the format of the table to fit your design needs.
- Select any cell in the table and go to the Design tab.
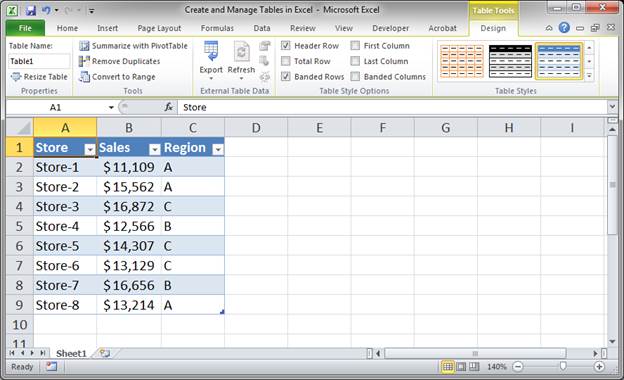
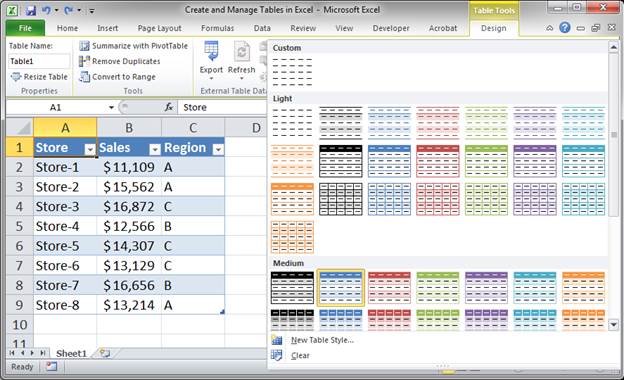
- Look to the Table Styles section on the right and click the More button to expand it.
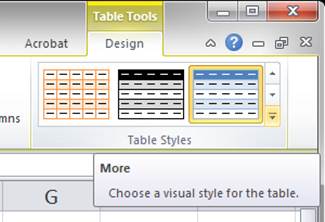
- Here, you can see lots of pre-made styles and hovering over them will show you what it would look like with your data.
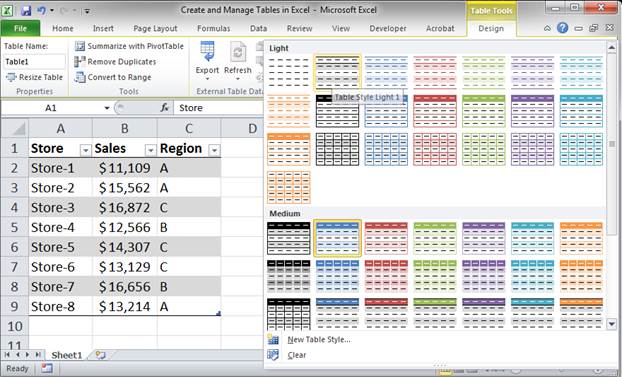
- If you don't like one of the pre-made styles, click New Table Style... located at the bottom of the window.
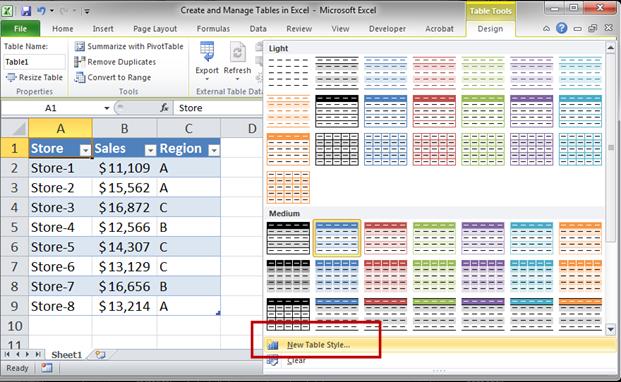
- A window will open that allows you to edit the formatting for each individual element of the table.
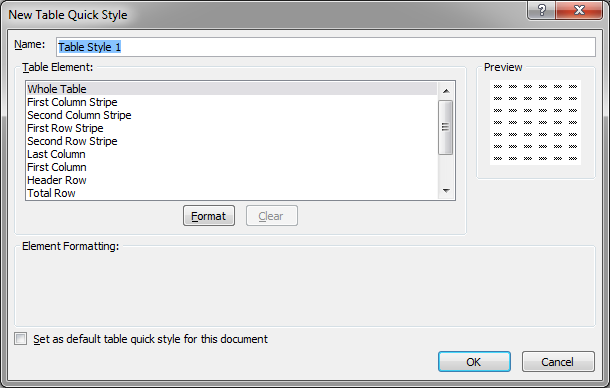
You select the desired element from the Table Element section and then click the Format button to select the format and when you are done hit the OK button - You can then select the new format from the Custom section that will now be present at the top of the Table Styles section.
Formatting is not the most important feature of tables but it does allow you to make nice looking data sets with ease and which are easy to read.
Add Data to a Table
Adding data to tables is very easy because everything updates for you.
- Simply select the first cell below the current data set and begin typing.
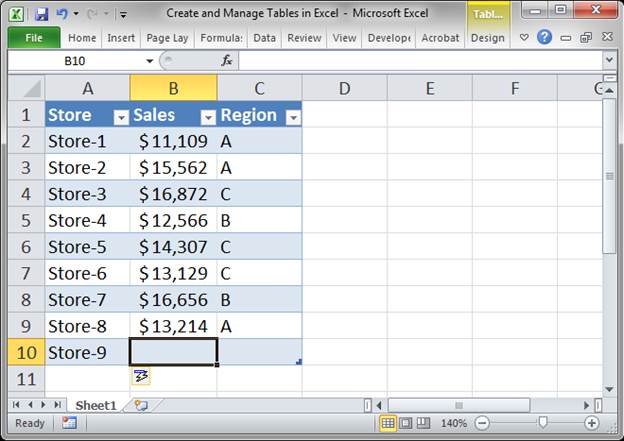
The moment you finish entering a value into the cell the table formatting will expand to encompass the new data as well as allow all table features to automatically work for this new row of data. If you had a column of formulas, those would also automatically copy down to the new row.
Add Columns to a Table
If you need to add a new column to a table, this works like adding a row.
- Select the first cell to the right of the current table and begin typing a header or a data point anywhere along the current data table.
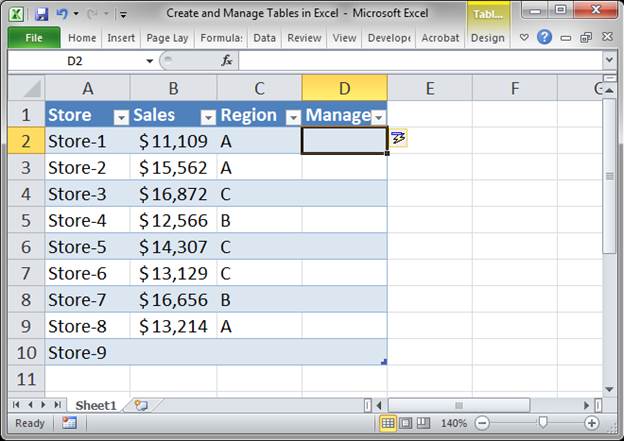
When you finish entering data in the new column the table automatically expands to encompass the new column.
Sort a Table
Tables have built-in sorting features enabled by default and they are easy to access.
- Click the small arrow on the right side of any header cell and you get access to all sorting options.
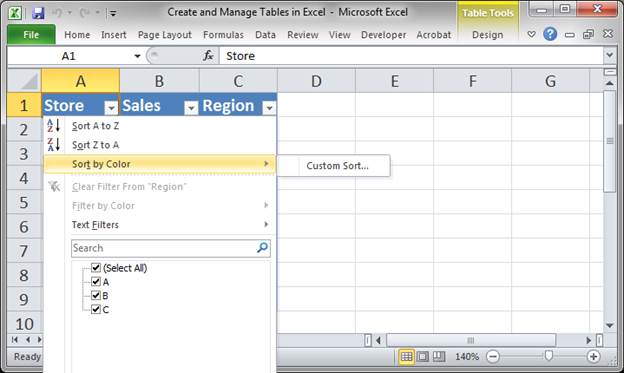
At the top of the menu that appears you have Sort A to Z, Sort Z to A, and the Custom Sort option when you hover your mouse over Sort by Color. - Clicking Custom Sort will get you to the advanced sort window:
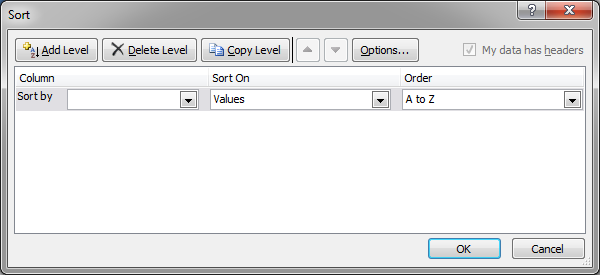
- From there you can sort however you like.
As you can see, sorting is easy.
Filter a Table
Filtering data in a table is as easy as sorting it.
- Click the drop down arrow in one of the header cells to filter that column and you get all of your normal filter options.
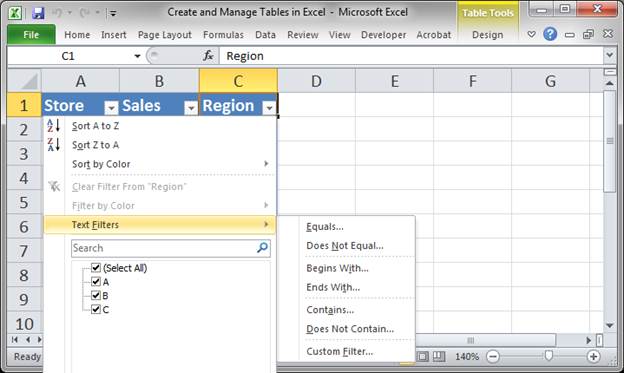
Basically, the table feature sets-up your data for filtering by default.
Add a Total Row with Automated Functions
You can add a row that has automated functions that appear when you select them from a list. This makes adding "total" functions, which sum up or average or do something with the data in the table, very easy.
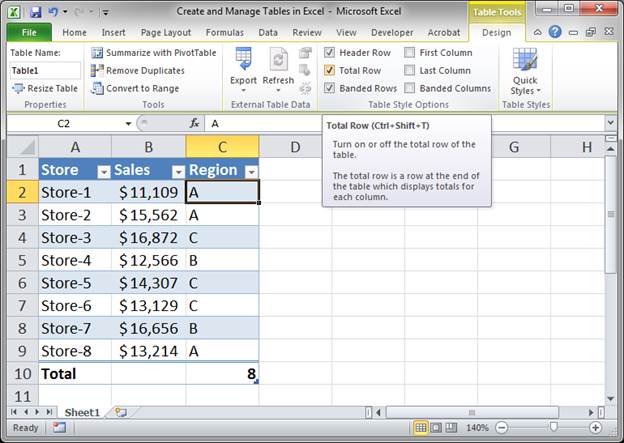
- Click anywhere in your table and then go to the Design tab and put a check mark next to the option Total Row. Or, select the table and hit Ctrl + Shift + T.
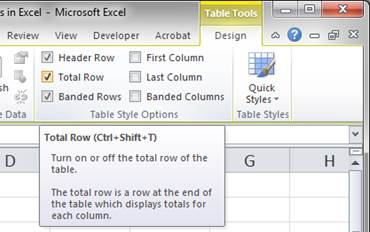
- There is now a row at the bottom of the table that says Total.
- Click a cell in that row and you will see a small arrow appear; click that arrow and a list of functions that you can use appears. Select the desired function or click More Functions to access all of the possible functions.
I want to find out the average sales for my stores so I click Average.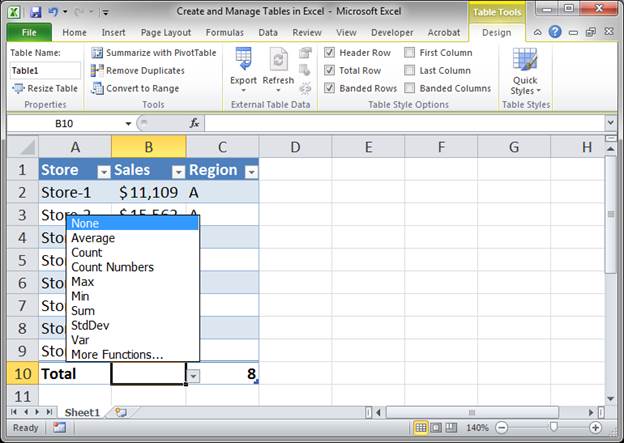
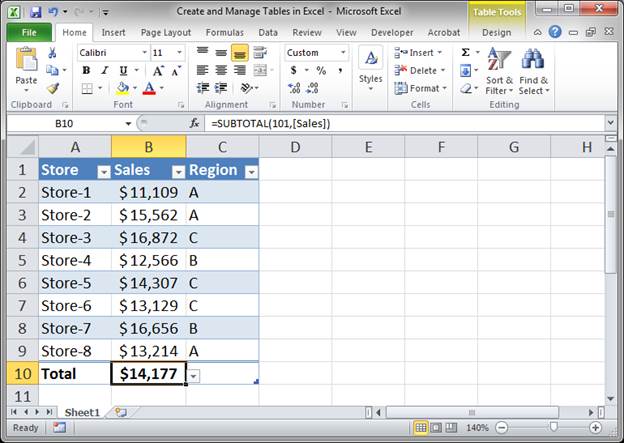
- Excel automatically enters the Average function and applies it to every row in the Sales column within the data table; I didn't have to enter a single thing and that is the beauty of tables in Excel.
To remove a function from the totals row, click the desired cell and then the arrow and select None from the list of possible functions.
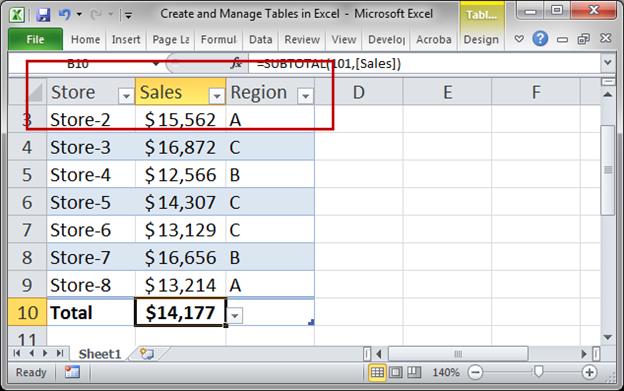
Static Headers
Another great feature of tables is that the headers of the columns are always visible. When you scroll down they take the place of the column headers and the Sort and Filter option arrows also appear there so you can sort and filter from anywhere in the table without having to scroll back to the top.
Notes
Tables in Excel are very helpful and make life a lot easier when dealing with large sets of data. They don't do anything that you couldn't do on your own, they just make doing that easier.
There are many more features available for tables in Excel so don't stop here, check out our other tutorials to learn more.
Make sure to download the workbook that accompanies this tutorial so you can see everything I talked about in this tutorial.
Question? Ask it in our Excel Forum
Excel VBA Course - From Beginner to Expert
200+ Video Lessons 50+ Hours of Instruction 200+ Excel Guides
Become a master of VBA and Macros in Excel and learn how to automate all of your tasks in Excel with this online course. (No VBA experience required.)
Tutorial: Easy way to reference data tables and make formulas within a data table. This allows you ...
Tutorial: In this tutorial I am going to introduce you to creating and managing charts in Excel. Bef...
Tutorial: How to manage Names in Excel so they are easy to view and change as needed. This is a li...
Tutorial: Visually nice way to add Date and Location Filters in Excel. This combines Tables with Sl...
Tutorial: 3 ways to better use Slicers for Pivot Tables in Excel. These tips will show you how to a...
Tutorial: Visually combine and compare data in Excel in less than 1 minute! This technique takes ...
Subscribe for Weekly Tutorials
BONUS: subscribe now to download our Top Tutorials Ebook!
Excel VBA Course - From Beginner to Expert
200+ Video Lessons
50+ Hours of Video
200+ Excel Guides
Become a master of VBA and Macros in Excel and learn how to automate all of your tasks in Excel with this online course. (No VBA experience required.)