Connect the Line for a Chart in Excel and Skip Blanks
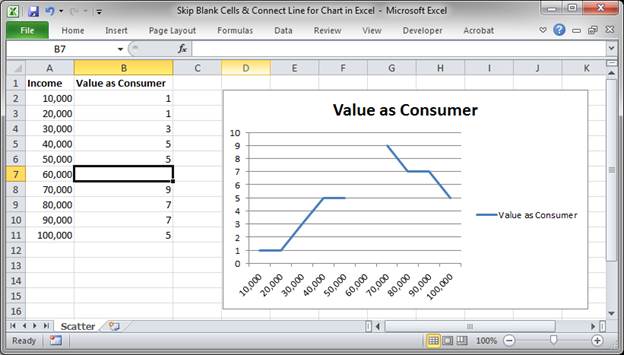
How to prevent a line chart from having a blank spot or also dropping to zero when there is a blank cell or a zero value that should be blank cell.
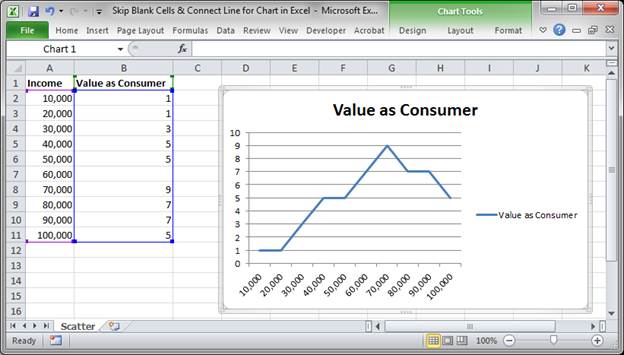
Here is the problem:
Connect the Line for a Line Chart
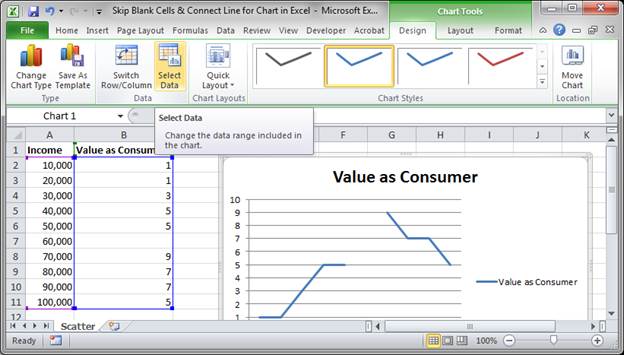
- Click the desired chart and then go to the Design tab that should appear and click Select Data.
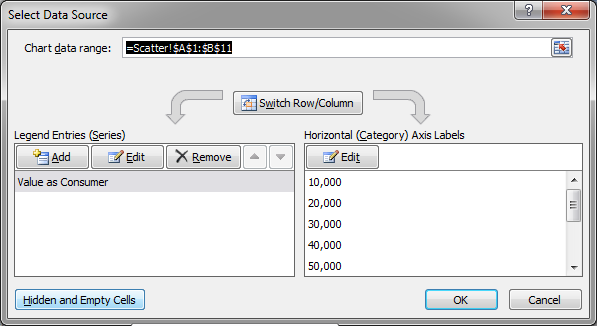
- In the window that opens, click Hidden and Empty Cells
- In the smaller window that opens click Connect data points with line and hit OK.
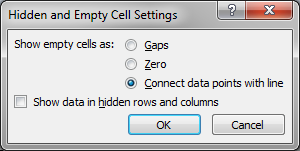
- That's it!
Zeros that Should be Blanks
If you have zeros in your data that you are using to represent a blank value, the chart will not understand this and will, instead, represent it as zero in the chart.
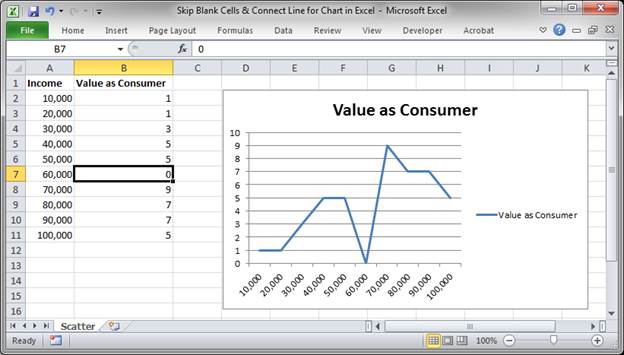
As such, DO NOT use a zero to denote emptiness in a set of data that you will put into a chart or it won't look right.
Notes
Download the accompanying spreadsheet to see this in Excel.
Question? Ask it in our Excel Forum
Excel VBA Course - From Beginner to Expert
200+ Video Lessons 50+ Hours of Instruction 200+ Excel Guides
Become a master of VBA and Macros in Excel and learn how to automate all of your tasks in Excel with this online course. (No VBA experience required.)
Tutorial: How to change the name of a chart in Excel. This allows you to use a more intuitive char...
Tutorial: In this tutorial I am going to show you how to update, change and manage the data used by ...
Tutorial: How to use an image for the background of a chart in Excel. Simple but fun way to spruce...
Macro: This macro will pull the values from a chart in excel and list those values on another spr...
Macro: Reverse cell contents with this free Excel UDF (user defined function). This will mir...
Tutorial: How to add, edit, and position charts in Excel using VBA. This tutorial covers what to do ...
Subscribe for Weekly Tutorials
BONUS: subscribe now to download our Top Tutorials Ebook!
Excel VBA Course - From Beginner to Expert
200+ Video Lessons
50+ Hours of Video
200+ Excel Guides
Become a master of VBA and Macros in Excel and learn how to automate all of your tasks in Excel with this online course. (No VBA experience required.)