Combine Multiple Chart Types in Excel to Make Powerful Charts
In this tutorial I am going to show you how to combine multiple chart types to create a single chart in Excel.
This will help you understand how to create more powerful charting tools for reporting and analyzing data.
To start, set up your chart with 2 data series:
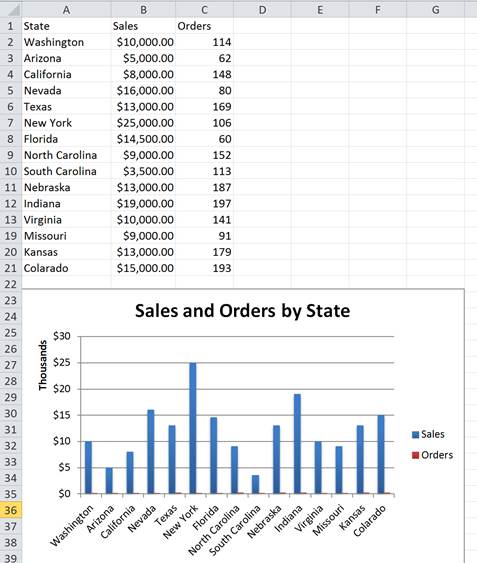
Initially this doesnt look great as the values for the number of Orders are so small they are barely showing on the same axis as the Sales.
Adding an Axis to a Chart in Excel
The solution is to move the Orders data series onto a second axis, which will allow you to have 2 separate number formats and 2 scales on the same chart.
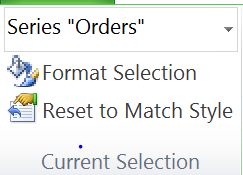
To do this, select the desired data series in the chart then click the Format Selection button from the Format tab.
Navigate to the Series Options tab:
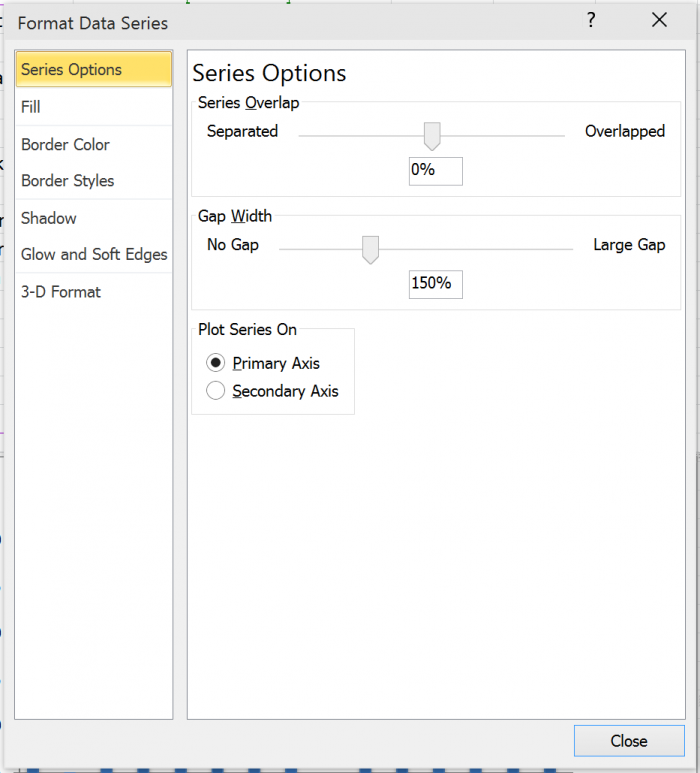
You then select the Secondary Axis checkbox:

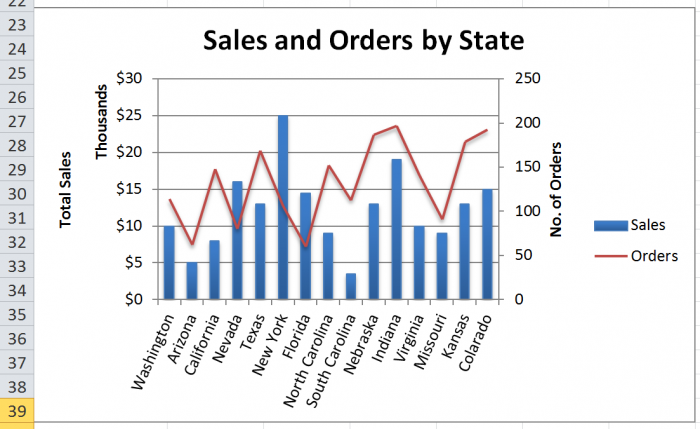
Now the chart looks like this:
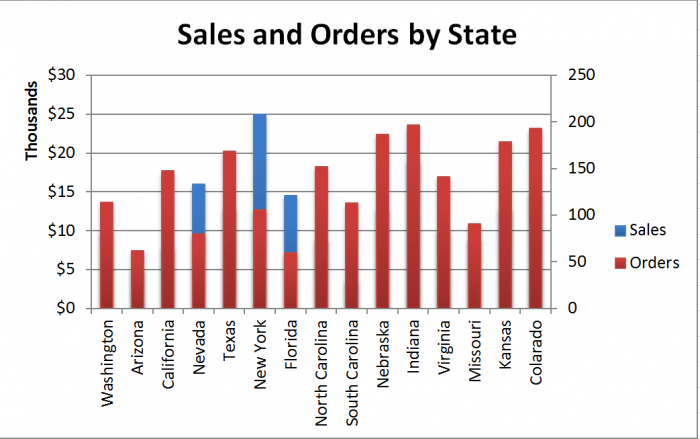
Having 2 vertical axes allows 2 different scales which helps the chart display better.
Total Sales are in thousands of dollars and No. Orders are in the 100s yet they can still be displayed correctly on the same chart. However, as both data series are the same chart type, the Orders data series is overlapping the Sales data series, making the latter harder to read.
Add the Second Chart Type to a Chart in Excel
The chart type of the Orders data series needs to be changed. To do so, select it, and then click the Change Chart Type button from the Design tab.
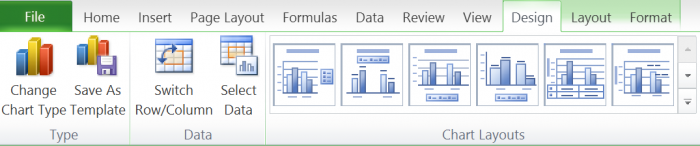
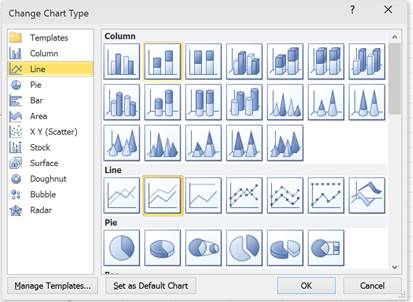
For this example, I am going to change the Orders series from a column chart to a line chart.
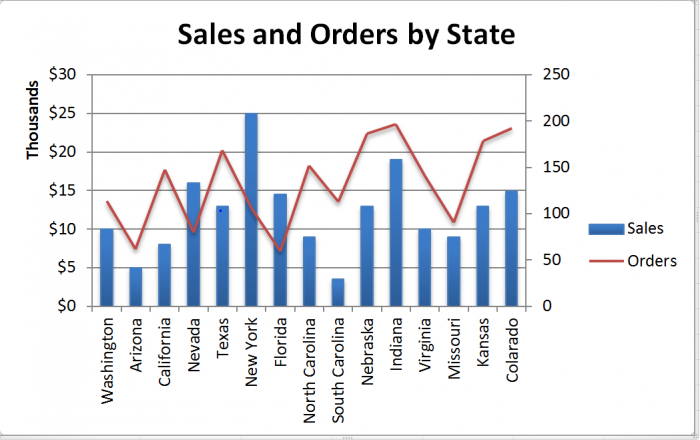
As you can see, this chart looks a lot better now and is easier to read.
Now that the secondary axis is setup, you can format the chart as usual. Most formatting options work the exact same way. The only difference is that there are more parts of the chart to format. Particularly the Layout tab changes slightly for certain dropdowns.
The Layout options which adjust the axis such as Axis Titles will have dropdowns for the primary and secondary axis like so:
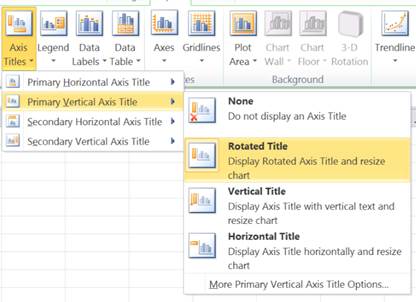
Adding Axis Titles might seem more complicated here but it works the same way. Just select the option from the dropdown for each of your axis.
At this point, we have a fully functioning and nice looking chart in Excel which is composed of two separate chart types for two different sets of data but all contained within the same chart.
This is the power of charting in Excel!
Don't forget to check-out our many other tutorials on charts in Excel.
Question? Ask it in our Excel Forum
Excel VBA Course - From Beginner to Expert
200+ Video Lessons 50+ Hours of Instruction 200+ Excel Guides
Become a master of VBA and Macros in Excel and learn how to automate all of your tasks in Excel with this online course. (No VBA experience required.)
Tutorial: Guide to combining and consolidating data in Excel. This includes consolidating data from ...
Tutorial: Forms Course How to apply custom conditional formatting combined with custom data validat...
Macro: This Excel macro filters data in Excel to display results that contain 1 of 2 possible val...
Macro: This free Excel macro filters data in Excel based on multiple criteria for one field in th...
Tutorial: Visually nice way to add Date and Location Filters in Excel. This combines Tables with Sl...
Macro: This Excel macro filters a set of data in Excel and displays only the top X percent of tha...
Subscribe for Weekly Tutorials
BONUS: subscribe now to download our Top Tutorials Ebook!
Excel VBA Course - From Beginner to Expert
200+ Video Lessons
50+ Hours of Video
200+ Excel Guides
Become a master of VBA and Macros in Excel and learn how to automate all of your tasks in Excel with this online course. (No VBA experience required.)