Add, Manage, & Remove Trendlines in Charts in Excel
How to add, manage, and remove trendlines in Excel
Trendlines allow you to show trends in charts that might be otherwise difficult to notice. Basically, this is mostly used as a visual aid to illustrate an upward, downward, or flat trend over varying data points in a chart.
Sections:
Add a Trendline to a Chart
- Select the desired chart by clicking it.
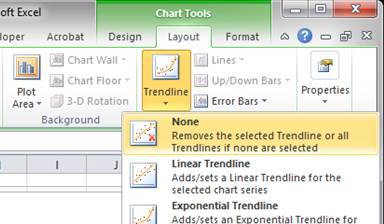
- Three tabs should then appear, go to the Layout tab and click Trendline
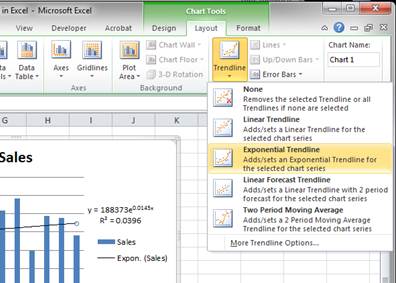
You can select a Trendline option from the drop down menu or, if you want more control over the Trendline, click More Trendline Options...
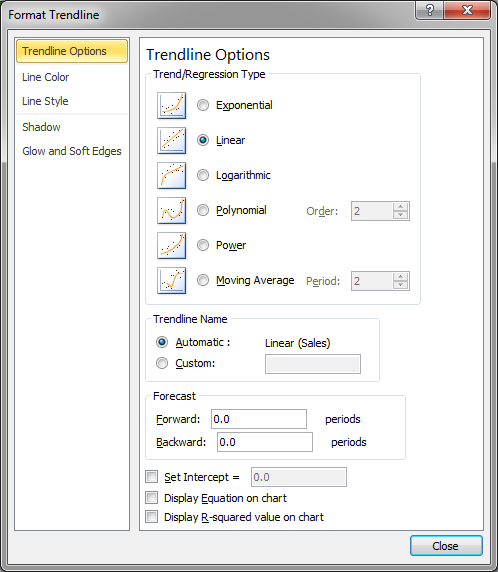
If you selected a basic option you are done, otherwise continue to Step 3. - Once you click More Trendline Options, a window will open that allows you to select the type of Trendline and options related to its calculation, display, and appearance.

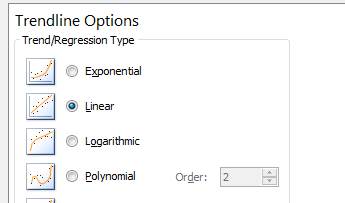
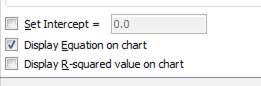
- I will select the basic option Linear; Linear and Exponential are the two most often used options. Then, I want to display the Equation used to generate the Trendline, so I check that option at the bottom of the window.
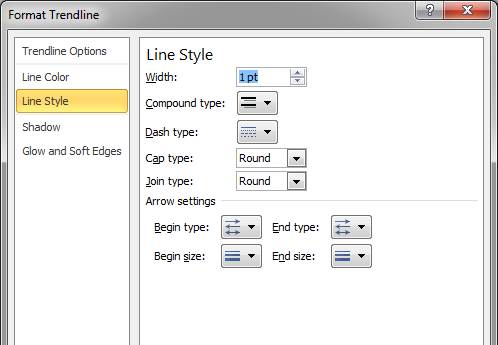
- If you want to change the look and style of the line, select from the categories on the left side of the window: Line Color, Line Style, Shadow, or Glow and Soft Edges.
- Hit the Close button at the bottom of the window when you are finished and that's it!
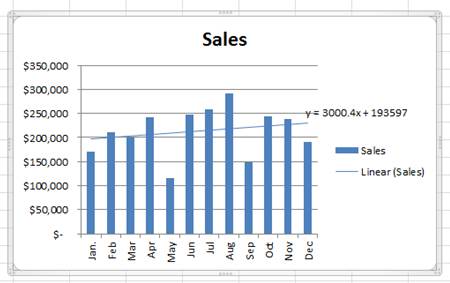
You will notice the mathematical equation that appears to the right of the Trendline. That is the formula used to generate the Trendline and you can move it anywhere on the chart by clicking it and dragging it.
Basically, that is all there is to creating a Trendline in Excel.
Manage a Trendline
To manage a Trendline, you just have to get to the Trendline Options window.
- Click the desired chart and then specifically click the Trendline (this is important because you can have more than one Trendline on a chart).
- Go to the Layout tab.
- Click the Trendline button and then click More Trendline Options...
- From the window that appears, you can manage every aspect of the Trendline.
Remove a Trendline
- Click the desired chart and then specifically click the Trendline that you want to remove (this is important because you can have more than one Trendline on a chart). If you have only one Trendline on the chart or you want to remove all of them, then you do not need to specifically click a Trendline.
- Go to the Layout tab and click Trendline and then click None
- That's it!
Notes
Trendlines are features of charts that help you better visualize a pattern or trend so a user can more clearly analyze what is happening with the data. This feature can be quite helpful, especially when the chart by itself doesn't clearly convey the trend that you want to show, but you probably don't need to use a Trendline on every chart or else you will just annoy people and it won't actually be helpful.
Download the spreadsheet that accompanies this tutorial to see the above example in Excel.
Question? Ask it in our Excel Forum
Excel VBA Course - From Beginner to Expert
200+ Video Lessons 50+ Hours of Instruction 200+ Excel Guides
Become a master of VBA and Macros in Excel and learn how to automate all of your tasks in Excel with this online course. (No VBA experience required.)
Tutorial: In this tutorial I am going to introduce you to creating and managing charts in Excel. Bef...
Macro: This free Excel macro illustrates all of the possible parameters and arguments that yo...
Macro: This free Excel macro filters data in Excel based on multiple criteria for one field in th...
Macro: This free Excel macro filters data in Excel using the autofilter feature in an Excel macro...
Tutorial: In this tutorial I am going to show you how to update, change and manage the data used by ...
Tutorial: How to add, manage, and remove error bars in charts in Excel. Error bars allow you to sh...
Subscribe for Weekly Tutorials
BONUS: subscribe now to download our Top Tutorials Ebook!
Excel VBA Course - From Beginner to Expert
200+ Video Lessons
50+ Hours of Video
200+ Excel Guides
Become a master of VBA and Macros in Excel and learn how to automate all of your tasks in Excel with this online course. (No VBA experience required.)