Guide to Creating Charts with a Macro in Excel
How to add, edit, and position charts in Excel using VBA.
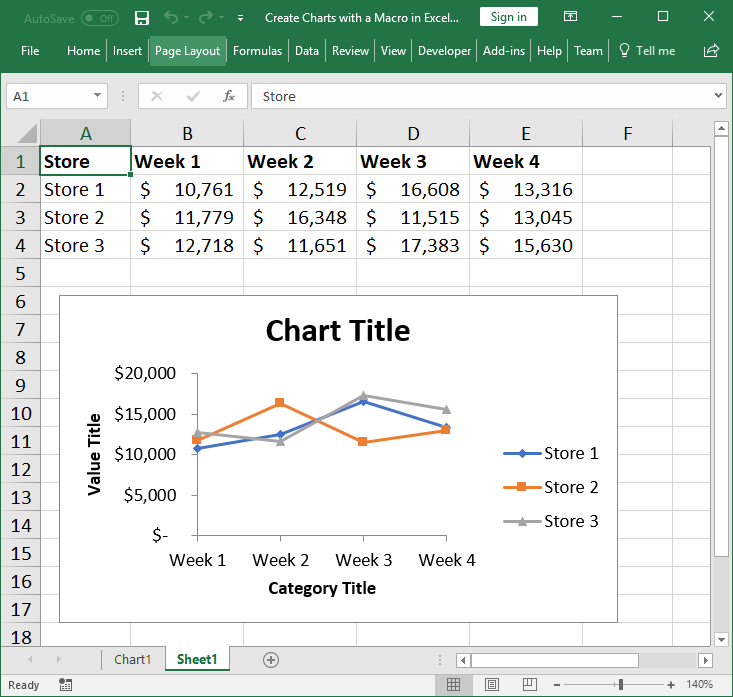
This tutorial covers what to do when adding the chart.
Sections:
Change Chart Size and Position
Add a Chart with VBA/Macros
Sub CreateChart()

'Tell the macro to make a variable that can hold the chart.
Dim myChart As ChartObject

'Create a chart and put the newly created chart inside of the variable created above.
Set myChart = Worksheets("sheet1").ChartObjects.Add(10, 80, 300, 175)

'Add some basic elements to the chart
myChart.Chart.ChartWizard _
    Source:=Worksheets("Sheet1").Range("A1:E4"), _
    Gallery:=xlLine, _
    Title:="Chart Title", _
    CategoryTitle:="Category Title", _
    ValueTitle:="Value Title", _
    HasLegend:=True

End Sub
This is the basic code for adding a chart to a worksheet using a macro. Each section of code in the macro has a comment that explains what that section does, also, each section below here explains how to change and use the macro in more detail.
Set Chart Source Data
This tells the chart what data to use.
Sub CreateChart()

'Tell the macro to make a variable that can hold the chart.
Dim myChart As ChartObject

'Create a chart and put the newly created chart inside of the variable created above.
Set myChart = Worksheets("sheet1").ChartObjects.Add(10, 80, 300, 175)

'Add some basic elements to the chart
myChart.Chart.ChartWizard _
    Source:=Worksheets("Sheet1").Range("A1:E4"), _
    Gallery:=xlLine, _
    Title:="Chart Title", _
    CategoryTitle:="Category Title", _
    ValueTitle:="Value Title", _
    HasLegend:=True

End Sub
Source:=Worksheets("Sheet1").Range("A1:E4") this holds the range reference for the chart.
Worksheets("Sheet1").Range("A1:E4") is the range reference.
Make sure to specify from which worksheet you want to get the source data, otherwise, it will come from the currently active or visible worksheet.
Possible Values
Any range from any worksheet, including named ranges.
Set Chart Type
This controls the type of chart to use.
Sub CreateChart()

'Tell the macro to make a variable that can hold the chart.
Dim myChart As ChartObject

'Create a chart and put the newly created chart inside of the variable created above.
Set myChart = Worksheets("sheet1").ChartObjects.Add(10, 80, 300, 175)

'Add some basic elements to the chart
myChart.Chart.ChartWizard _
    Source:=Worksheets("Sheet1").Range("A1:E4"), _
    Gallery:=xlLine, _
    Title:="Chart Title", _
    CategoryTitle:="Category Title", _
    ValueTitle:="Value Title", _
    HasLegend:=True

End Sub
Gallery:=xlLine the name of this argument is Gallery, which can seem confusing, but it just controls the type of chart that will be used to display your source data. xlLine is the type of chart that will be used - you can view a full list of possible chart types below here.
List of Possible Chart Types:
| Name | Value | Description |
|---|---|---|
| xl3DArea | -4098 | 3D Area. |
| xl3DAreaStacked | 78 | 3D Stacked Area. |
| xl3DAreaStacked100 | 79 | 100% Stacked Area. |
| xl3DBarClustered | 60 | 3D Clustered Bar. |
| xl3DBarStacked | 61 | 3D Stacked Bar. |
| xl3DBarStacked100 | 62 | 3D 100% Stacked Bar. |
| xl3DColumn | -4100 | 3D Column. |
| xl3DColumnClustered | 54 | 3D Clustered Column. |
| xl3DColumnStacked | 55 | 3D Stacked Column. |
| xl3DColumnStacked100 | 56 | 3D 100% Stacked Column. |
| xl3DLine | -4101 | 3D Line. |
| xl3DPie | -4102 | 3D Pie. |
| xl3DPieExploded | 70 | Exploded 3D Pie. |
| xlArea | 1 | Area |
| xlAreaStacked | 76 | Stacked Area. |
| xlAreaStacked100 | 77 | 100% Stacked Area. |
| xlBarClustered | 57 | Clustered Bar. |
| xlBarOfPie | 71 | Bar of Pie. |
| xlBarStacked | 58 | Stacked Bar. |
| xlBarStacked100 | 59 | 100% Stacked Bar. |
| xlBubble | 15 | Bubble. |
| xlBubble3DEffect | 87 | Bubble with 3D effects. |
| xlColumnClustered | 51 | Clustered Column. |
| xlColumnStacked | 52 | Stacked Column. |
| xlColumnStacked100 | 53 | 100% Stacked Column. |
| xlConeBarClustered | 102 | Clustered Cone Bar. |
| xlConeBarStacked | 103 | Stacked Cone Bar. |
| xlConeBarStacked100 | 104 | 100% Stacked Cone Bar. |
| xlConeCol | 105 | 3D Cone Column. |
| xlConeColClustered | 99 | Clustered Cone Column. |
| xlConeColStacked | 100 | Stacked Cone Column. |
| xlConeColStacked100 | 101 | 100% Stacked Cone Column. |
| xlCylinderBarClustered | 95 | Clustered Cylinder Bar. |
| xlCylinderBarStacked | 96 | Stacked Cylinder Bar. |
| xlCylinderBarStacked100 | 97 | 100% Stacked Cylinder Bar. |
| xlCylinderCol | 98 | 3D Cylinder Column. |
| xlCylinderColClustered | 92 | Clustered Cone Column. |
| xlCylinderColStacked | 93 | Stacked Cone Column. |
| xlCylinderColStacked100 | 94 | 100% Stacked Cylinder Column. |
| xlDoughnut | -4120 | Doughnut. |
| xlDoughnutExploded | 80 | Exploded Doughnut. |
| xlLine | 4 | Line. |
| xlLineMarkers | 65 | Line with Markers. |
| xlLineMarkersStacked | 66 | Stacked Line with Markers. |
| xlLineMarkersStacked100 | 67 | 100% Stacked Line with Markers. |
| xlLineStacked | 63 | Stacked Line. |
| xlLineStacked100 | 64 | 100% Stacked Line. |
| xlPie | 5 | Pie. |
| xlPieExploded | 69 | Exploded Pie. |
| xlPieOfPie | 68 | Pie of Pie. |
| xlPyramidBarClustered | 109 | Clustered Pyramid Bar. |
| xlPyramidBarStacked | 110 | Stacked Pyramid Bar. |
| xlPyramidBarStacked100 | 111 | 100% Stacked Pyramid Bar. |
| xlPyramidCol | 112 | 3D Pyramid Column. |
| xlPyramidColClustered | 106 | Clustered Pyramid Column. |
| xlPyramidColStacked | 107 | Stacked Pyramid Column. |
| xlPyramidColStacked100 | 108 | 100% Stacked Pyramid Column. |
| xlRadar | -4151 | Radar. |
| xlRadarFilled | 82 | Filled Radar. |
| xlRadarMarkers | 81 | Radar with Data Markers. |
| xlStockHLC | 88 | High-Low-Close. |
| xlStockOHLC | 89 | Open-High-Low-Close. |
| xlStockVHLC | 90 | Volume-High-Low-Close. |
| xlStockVOHLC | 91 | Volume-Open-High-Low-Close. |
| xlSurface | 83 | 3D Surface. |
| xlSurfaceTopView | 85 | Surface (Top View). |
| xlSurfaceTopViewWireframe | 86 | Surface (Top View wireframe). |
| xlSurfaceWireframe | 84 | 3D Surface (wireframe). |
| xlXYScatter | -4169 | Scatter. |
| xlXYScatterLines | 74 | Scatter with Lines. |
| xlXYScatterLinesNoMarkers | 75 | Scatter with Lines and No Data Markers. |
| xlXYScatterSmooth | 72 | Scatter with Smoothed Lines. |
| xlXYScatterSmoothNoMarkers | 73 | Scatter with Smoothed Lines and No Data Markers. |
Change Chart Title
Title of the chart.
Sub CreateChart()

'Tell the macro to make a variable that can hold the chart.
Dim myChart As ChartObject

'Create a chart and put the newly created chart inside of the variable created above.
Set myChart = Worksheets("sheet1").ChartObjects.Add(10, 80, 300, 175)

'Add some basic elements to the chart
myChart.Chart.ChartWizard _
    Source:=Worksheets("Sheet1").Range("A1:E4"), _
    Gallery:=xlLine, _
    Title:="Chart Title", _
    CategoryTitle:="Category Title", _
    ValueTitle:="Value Title", _
    HasLegend:=True

End Sub
Title:="Chart Title" put whatever you want inside of the quotation marks for the title of the chart.
Set Category and Value Titles
Sub CreateChart()

'Tell the macro to make a variable that can hold the chart.
Dim myChart As ChartObject

'Create a chart and put the newly created chart inside of the variable created above.
Set myChart = Worksheets("sheet1").ChartObjects.Add(10, 80, 300, 175)

'Add some basic elements to the chart
myChart.Chart.ChartWizard _
    Source:=Worksheets("Sheet1").Range("A1:E4"), _
    Gallery:=xlLine, _
    Title:="Chart Title", _
    CategoryTitle:="Category Title", _
    ValueTitle:="Value Title", _
    HasLegend:=True

End Sub
CategoryTitle:="Category Title" the title that goes along the bottom of the chart. Put whatever you want within the quotation marks.
ValueTitle:="Value Title" the title that goes along the left side of the chart. Put whatever you want within the quotation marks.
Include a Legend
Sub CreateChart()

'Tell the macro to make a variable that can hold the chart.
Dim myChart As ChartObject

'Create a chart and put the newly created chart inside of the variable created above.
Set myChart = Worksheets("sheet1").ChartObjects.Add(10, 80, 300, 175)

'Add some basic elements to the chart
myChart.Chart.ChartWizard _
    Source:=Worksheets("Sheet1").Range("A1:E4"), _
    Gallery:=xlLine, _
    Title:="Chart Title", _
    CategoryTitle:="Category Title", _
    ValueTitle:="Value Title", _
    HasLegend:=True

End Sub
HasLegend:=True when this is set to True, a legend will appear - also, often times a legend will appear by default. If you want to make sure there is no legend, set this value to False.
Possible Values
True show a legend.
False don't show a legend.
Sometimes legends appear by default; use False when you want to ensure that none will appear.
Change Chart Size and Position
Sub CreateChart()

'Tell the macro to make a variable that can hold the chart.
Dim myChart As ChartObject

'Create a chart and put the newly created chart inside of the variable created above.
Set myChart = Worksheets("sheet1").ChartObjects.Add(10, 80, 300, 175)

'Add some basic elements to the chart
myChart.Chart.ChartWizard _
    Source:=Worksheets("Sheet1").Range("A1:E4"), _
    Gallery:=xlLine, _
    Title:="Chart Title", _
    CategoryTitle:="Category Title", _
    ValueTitle:="Value Title", _
    HasLegend:=True

End Sub
ChartObjects.Add(10, 80, 300, 175) the numbers here control the size and position of the chart.
Add(Left, Top, Width, Height)
10 is the position from the left side of the worksheet. You can set this number to whatever you want so that the chart fits into your data nicely.
80 is the position from the top of the worksheet. You can set this number to whatever you want so that the chart fits into your data nicely.
300 is the width of the chart.
175 is the height of the chart.
Play around with these values until you get the desired size and position of the chart in your worksheet. Note that adding a legend to a chart will make it seem smaller as there will be less space for the data to be displayed.
Fewer Arguments
The above example includes a kind of 'interesting' way of writing the arguments for a function in VBA.
myChart.Chart.ChartWizard _
    Source:=Worksheets("Sheet1").Range("A1:E4"), _
    Gallery:=xlLine, _
    Title:="Chart Title", _
    CategoryTitle:="Category Title", _
    ValueTitle:="Value Title", _
    HasLegend:=True
Each argument for the ChartWizard is put onto its own line and follows this format:
Source:= each line begins with the name of the argument and a :=
, _ each line ends with a comma and an underscore.
Last line this is important! The last line for the ChartWizard, should not end with , _ Notice that the last line is this: HasLegend:=True but if you did not want to include the HasLegend argument and wanted it to end with the ValueTitle argument, you would delete the HasLegend argument (entire line) and remove the , _ from the Value Title argument, like this:
myChart.Chart.ChartWizard _
    Source:=Worksheets("Sheet1").Range("A1:E4"), _
    Gallery:=xlLine, _
    Title:="Chart Title", _
    CategoryTitle:="Category Title", _
    ValueTitle:="Value Title"
This may seem confusing at first, but it's standard practice in VBA and Macros.
Notes
There are many ways to add charts to Excel, especially considering new and old versions of the program; however, the example above provides a robust solution that will work across many versions of Excel.
Download the sample file to see the above examples in Excel.
Question? Ask it in our Excel Forum
Excel VBA Course - From Beginner to Expert
200+ Video Lessons 50+ Hours of Instruction 200+ Excel Guides
Become a master of VBA and Macros in Excel and learn how to automate all of your tasks in Excel with this online course. (No VBA experience required.)
Tutorial: How to have a macro do something on a set interval of rows; for instance, input a value ev...
Macro: Create a line chart in Excel with this macro. This allows you to quickly and easily create...
Macro: This macro adds a column chart to Excel. This is an easy to use macro that allows you to q...
Macro: Create a bar chart in Excel with this macro. You will be able to quickly and easily turn a...
Tutorial: How to input data into cells in a worksheet from a macro. Once you have data in your macro...
Tutorial: Here, you'll learn how to get information from the Excel worksheet into a macro so you can...
Subscribe for Weekly Tutorials
BONUS: subscribe now to download our Top Tutorials Ebook!
Excel VBA Course - From Beginner to Expert
200+ Video Lessons
50+ Hours of Video
200+ Excel Guides
Become a master of VBA and Macros in Excel and learn how to automate all of your tasks in Excel with this online course. (No VBA experience required.)